The Importance of Quality Score

How Important is Quality Score?

Paid search, oftentimes in conjunction with SEO, remains an essential marketing element for many businesses. This being said, it’s surprising that a lot of companies don’t know what makes a campaign succeed. Of the many factors that contribute to a successful paid campaign, AdWords quality score is one of the most important. This blog will explain what quality score is, why it matters, and what you can do to improve it.

What is Quality Score?

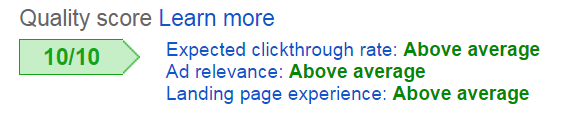
According to Google, “quality score is an estimate of the quality of your ads, keywords, and landing pages.” It is determined at the keyword level and is represented as a number between 1 and 10. All things equal, the higher your quality score the better your ads will perform. An increase in quality score can lead to better ad rank, higher clickthrough rates, and cheaper clicks. Google determines quality score by evaluating three factors: expected clickthrough rate, ad relevance, and landing page experience. These three factors are rated either below average, average, or above average.

Quality Score

Expected Clickthrough Rate

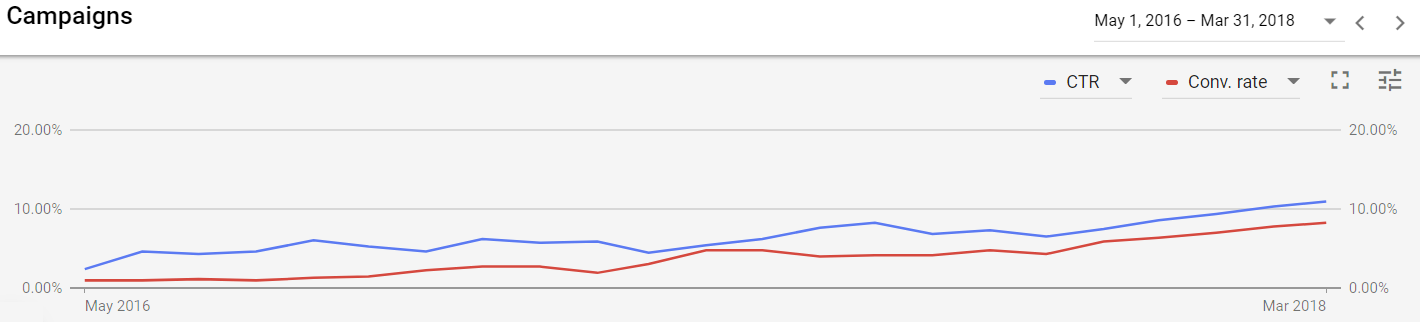
Expected clickthrough rate takes into account the historical performance of your ads. At the same time, it excludes the effects of ad position (higher ad positions generally lead to better clickthrough rates), ad extensions, and ad formats. Clickthrough rate is a good indicator of relevance and can help you know if you’re sending the right message to the right audience. Your ads are more likely to be clicked when your ad copy is compelling and relevant

Ad Relevance

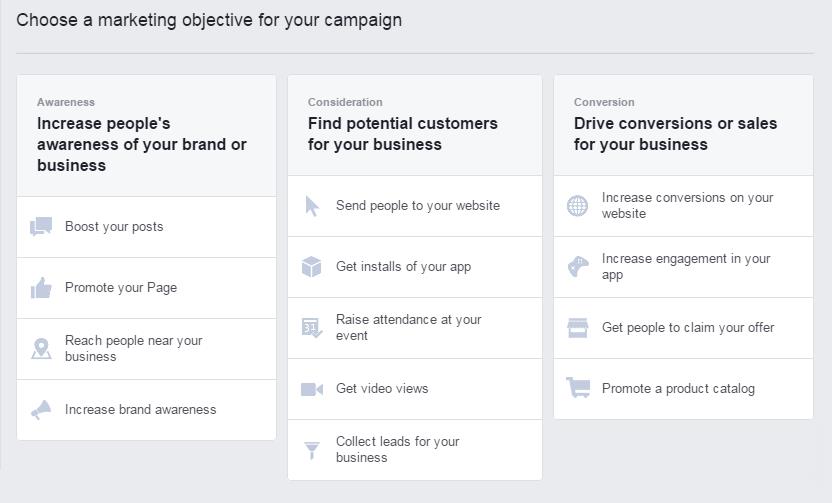
The second factor that affects quality score is ad relevance which measures how closely your ads match your keywords. If your ads brag about the cleanliness of your hotel rooms but appears when someone searches for flights to Dallas your ad relevance will suffer. If your keywords have below average ad relevance you may need to rewrite your ads or break up your ad groups into more specific ad groups. Whenever the search volume justifies it, you should make your ad groups as specific as possible and then match your ad copy to the keywords.

Landing Page Experience

Your landing page is evaluated on its content (is it relevant, useful and original?), transparency and trustworthiness, ease of navigation, and loading time. If your landing page was designed following industry best practice you won’t need to change very much. Just make sure you’re sending people to the landing page that most closely matches their search.

You may have noticed that each of the three quality score factors mention relevance. This is the heart of the whole matter. If you want your ads to perform well if you want a high-quality score, ensure that your ads, keywords, ad groups, and landing pages are all related. People don’t like having to search through websites to find what they’re looking for. Managing the data of short-tail and long-tail keywords can be challenging at scale. Use a tool like Linkio to keep your various keywords organized.

If you would like to see your quality score improve and drive more qualified traffic to your website, contact Epic Marketing today for a free consultation!

Three Reasons Why Every Business Should Use Google Optimize

Google has so many products and platforms it can be difficult to keep them all straight. Daydream View, Tilt Brush, Google Duo, and Google Expedition just to name a few of the more obscure ones. One of my personal favorites (aside from Google Ads of course) is Google Optimize.

Google Optimize is a free CRO tool that allows you to create different versions of your site to run experiments on. There is a premium version of Optimize, but the free version can add value to any business, regardless of size or industry. Here are three reasons why every business should be using Google Optimize.

It’s Easy to Set Up

Although most CRO tools aren’t too difficult to set up, the free version of Google Optimize was never meant to be an enterprise-level tool so it is incredibly easy to set up. You can install it using the Global Site Tag (gtag.js), Google Tag Manager, or even Universal Analytics. For more information on any of those methods, click on the hyperlinks.

It’s Free, What More Could You Want?

CRO tools typically cost hundreds if not thousands of dollars a month, but Google doesn’t charge you anything to use their tool. Despite this, you have access to A/B testing, multivariate tests, redirect tests, and personalization. And have I mentioned it’s free?

You Can Do a Lot With It

I’m going to repeat what I said before: this free tool lets you run A/B tests, multivariate tests, redirect tests, and personalization. That is incredible. Let’s dive a little deeper into the different options.

A/B Tests

A/B tests are perhaps the easiest to understand. Will you get more sales if the buy button is blue? Or maybe red? Does this headline lead to more phone calls than this other headline? These are classic examples of A/B tests. Typically, it’s best to test one change at a time so you can easily determine what led to the improvement. You can make as many changes as you want, but if you make 30 changes and end up with more conversions you won’t be able to know which of your changes led to the increase conversion rate.

Multivariate Tests

Instead of just testing two different versions of a page, multivariate tests allow you to mix and match different changes. This image from the Google Optimize Resource Hub should help illustrate this:

Redirect Tests

Unlike classic A/B tests or multivariate tests, you are not making changes to an existing page with a redirect test. Instead, you are directing traffic to two completely different web pages. This is useful when you have two, very different pages on your site and you want to know what page will perform best. This applies to both URLs and subdomains.

Personalization

Unlike the other three capabilities, when you create personalized experiences you’re not trying to determine what will perform best. By this point in time, you should have run experiments and know that certain changes will work better for certain segments. You can personalize your website based on:

Device category
Desktop
Mobile
Tablet

Behavior
New vs. returning visitors
People coming from specific channels or sources

Geography
City
Region
Metro
Country

Technology
Browser (Chrome, Edge, Firefox, Internet Explorer, Opera, Safari)
Operating system (Android, Chrome OS, iOS, Linux, Macintosh, Windows, Windows Phone)
Mobile device info

There are also more advanced rules you can create using query parameters, data layer variables, JavaScript variables, first-party cookies, and custom JavaScript.

Yeah, that’s a lot of targeting options. Google Optimize is a powerful tool.

Conclusion

I am a big fan of Google Optimize. The fact that it’s easy to set up, has a free version, and is still incredibly powerful means that every business should at least try it. If it still seems too daunting, reach out to Epic Marketing and I’d be happy to set it up for you.

Google Ads Average Position is Going Away… Now What?

It wasn’t too long ago that Google announced they would be retiring the average position metric in September of this year, but many advertisers are still scratching their heads and wondering what to do in the meantime. Yes, Google rolled out top and absolute top impression share metrics, but many advertisers still rely on average position because it’s seems pretty straightforward (but we’ll get to that in a second) and more important it’s what they’ve been using for years. Change is one of the only constant things in the PPC industry, so what do advertisers need to know in order to seamlessly transition from average position to these newer metrics? Here are a few things you should understand and keep in mind.

Understanding the Differences

Average position, simply put, is your average ad position compared to other ads. Seems pretty simple, right? Hold that thought and we’ll get back to it.

Top impression share is the percentage of the time your ads are shown anywhere above the organic results. In other words, top impression share = Impressions on top/eligible impressions on top. If your ads are shown above the organic results every other time you would have a top impression share of 50%.

Absolute top impression share is the percentage of the time your ads are shown as the very first ad above the organic results. Absolute top impression share = Impressions on absolute top/eligible impressions on top. If your ads are shown above the organic results and as the very first ad every other time you would have a top impression share of 50%.

By its very nature, a percentage is a bit more nebulous than a number. Many of us can understand an average position of 2.2, but a search top impression share of 53.70%? That’s not as intuitive.

So what’s the difference? Average position only looks at where your ad is compared to other ads and the new metrics look at where your ad is compared to everything else on the SERP. You could have an average position of 1.0, but still not be above the fold. The metrics that are replacing average position should give you a better idea about where your ads are actually showing. Here’s a chart from Google that may help.

Average position chart

Are the New Metrics Better?

Technically, yes, I suppose they are. Otherwise, Google wouldn’t be getting rid of average position. However, I’m going to miss the simple, actionable insights you can gain from average position. Does average position paint the whole picture? No, but I’ve been using it for years and check it every time I get into one of my client’s accounts.

Maybe you’ve already transitioned to the new metrics, but if not, here are few ways you can start getting used to top impression share and absolute top impression share.

How to Use the New Metrics

First things first, Google’s automated bid strategies take the guesswork out of tweaking bids to optimize your impression share. There’s even a bid strategy that automatically adjusts your bids based on whether you want your ads to appear anywhere on the results page, at the top of the results page, or at the absolute top of the results page. If, however, you use manual bidding then you’ll need to understand how to use these metrics.

Top impression share big strategy

There are different schools of thought, but typically when I’m running a branded campaign I want to be the first ad. I would, therefore, adjust bids and/or budgets to maximize my absolute top impression share.

If I’m not running a branded campaign, I generally don’t want to be in the first ad position. I’ve found that although you usually get more clicks and a higher clickthrough rate, the increase in cost per click and more importantly cost per conversion isn’t worth it. In this case, I would focus more on top impression share. I don’t care about the absolute top, I just want to make sure my ads get seen.

How to Improve Impression Share

There are many different ways you can affect your impression shares, but I’m only going to cover some of the most common ones.

Budget – This one should be a no-brainer, the more you are willing or able to spend the more impression share you could have. That’s about all I have to say with this one.

Bids – At first glance, it would be easy to think that higher bids would always lead to higher impression share, but this is most definitely not the case. If you’re limited by budget then increasing your bids could actually lead to a decrease in impression share. Why is this? Higher bids usually lead to higher costs per click which means you’ll get even fewer clicks from your already strained budget. When you’re not limited by budget though, increasing your bids can be a great way to increase your impression share.

Quality score – This should come as no surprise, but a good quality score can dramatically improve the performance of your ads. When your ads consistently have high clickthrough rates, are relevant to the searcher’s query, and send the searcher to a well-designed landing page, Google rewards you. All things being equal, if you improve your quality score you will get a lower cost per click while at the same time increasing your ad rank. So your budget goes further and your ad appears higher in the SERPs, you’re killing two birds with one stone.

Final Thoughts

After reading this you should have at least a basic understanding of the differences between average position and the new top impression share metrics, how to use the new metrics, and a few ways you can improve your impression share. Using this information, I’d advise you to start incorporating top impression share and absolute top impression share into your routine campaign optimizations. You can continue to use average position for now, but remember – it’s going away in September.

Interested in a free Google Ads audit? Fill our contact form and we’ll be in touch!

What PPC Metrics Should You Focus On?

When it comes to Google Ads, there’s no shortage of metrics you can track and measure. Last time I checked, there were 101 metrics you can view at the campaign level. The campaign level. Who knows how many other unique metrics there would be if I included metrics at the ad group, ad, ad extension, etc. level? Needless to say (but I guess I’m saying it anyway), there are a lot of different metrics you can track to try and get a clear picture of your marketing efforts. But which metrics should you focus on? What metrics should you base your optimization efforts on? That’s what I want to address in this blog, but before we can answer that question there are a few things we need to consider.

What stage of the business life cycle are you in? Is your business just starting out? Are you an industry leader? What matters to a startup might not matter to a mature business. Let’s take a look at some metrics that matter more at different stages.

Start Up Stage

At this stage, you probably don’t have a lot of brand awareness. You may have a great product or service, but PPC isn’t going to help you very much if no one has ever heard of you. Because of that, many younger businesses focus on awareness metrics. These can include impressions, views, watch time, etc. At this point in time, you should be more focused on getting your brand out there. If you have a great product or service and a smart marketing plan, conversions will come.

Growth Stage

Your business is no longer an unknown and people don’t view doing business with you as risky. So what should you focus on? By now you should be trying to hone in on your messaging. At this stage, you should move on from awareness metrics and instead focus on relevance metrics. Metrics such as clickthrough rate, conversion rate, quality score, etc., help you know if your message and offer are resonating with your potential customers. You may still be limited by budget so it’s important to focus on the campaigns, ad groups, and ads that deliver the most relevant results.

Maturity Stage

By now, you’ve nailed down your ad copy and are well-established in the industry. You no longer need to focus on awareness or relevance, but can finally spend all of your efforts on driving more ROI. Conversion metrics such as cost per conversion or return on ad spend are incredibly powerful because you can use them to evaluate the effectiveness of your ads. Although you’re probably still limited by budget (unless you have deep pockets or are in a very niche industry), you can now focus on whatever combinations or settings, ad copy, and ad formats that deliver the most value. This is the stage that all business should hope to get to. Your Google Ads account is now a well-oiled machine and should continue to deliver great results month over month.

To recap, before you can decide what metric to you need to focus on you need to identify what stage your business is in. You may need to focus on awareness metrics, relevant metrics, or conversion metrics. There is no one right answer because every business is different, but whatever stage your business is in, Epic Marketing can help you grow and get to the next level. Contact us today to learn how we can help you!

Google’s Demo Analytics Account: How to Gain Access and Why You Want to

Google Analytics can be a labyrinth. From simple session tracking to the User Explorer report, Analytics can do a lot and it can be overwhelming to try to learn all of its tools and capabilities. Luckily, Google created a demo Analytics account based on traffic to their merchandise store that anyone can get access to and learn from. In this blog, I’m going to walk you through gaining access to this demo account and give you three reasons why it’s beneficial to learn from it.

How to Gain Access

This shouldn’t come as a surprise, but in order to use this Analytics account you have to have an account yourself. Google made it pretty easy to gain access to their demo account, all you have to do is visit this Google support page, scroll about halfway down the page and click on “ACCESS DEMO ACCOUNT”. And… that’s it! You now have access.

Google Analytics Demo Account

And now, three reasons you can learn a lot from this account.

Reason 1: They get Thousands of Visitors a Day

Google knows that sample size matters so instead of trying to learn from your own website (which may not get very much traffic), you can use their demo account that gets thousands of sessions per day. I cannot state how useful this is. One thing I consider on a daily basis is sample size. All things equal, the more data you have the more you can do with it. With the amount of traffic this account gets, you can determine with a decent amount of certainty which source has the highest conversation rate, which region visits the most pages on average, etc.

Reason 2: You can Experiment without Breaking Things

One of the risks of playing around with Google Analytics before you know what you’re doing is altering or erasing historical data. Well, you don’t have to worry about that here! You have enough access to learn, but not enough to mess things up for everyone else. So have fun, try new things!

Reason 3: Many Features are Already Set Up

Many advanced features have already been set up in this sample account. Things such as enhanced ecommerce, Google Ads (formerly AdWords) linking, dashboards, custom reports, etc., are already in place. This saves you the trouble of trying to figure out the implementation on your own. You can look at how they set things up and replicate their settings modify them based on your needs.

So there you have it. If you followed these instructions you should now be able to view the Google merchandise Analytics account and you know three reasons why it will be beneficial to you to learn from it.  This won’t magically make Google Analytics easier to navigate, but it should help you and provide you with a ball of yarn to escape the labyrinth.

Google Analytics User Explorer: What It Is and When to Use It

The numbers vary by source, but something like 90% of websites use Google Analytics in one form or another. Wow. I’m having a hard time thinking of any other service or product that has achieved that level of market penetration. Despite the fact that tens of millions of website are using Analytics, I bet there are sections within the Analytics interface that 90% of business owners have never used, seen, or even heard of. One of these sections is User Explorer.

Unveiled in the spring of 2016, this report does something that was previously next to impossible to do – track an individual’s journey on your website. User Explorer is found in the Audience section of Analytics. It lets you view data for individuals such as how they ended up on your site (referral, organic, social, etc.), what pages they visited, what events they triggered, and more. Of course, this is completely anonymized and no personal data is recorded *cough GDPR compliant cough*.

That’s all fine and dandy, but how would a marketer benefit from this information? In general, you should view aggregate data so you can make informed decisions (see my previous blog for an explanation of why sample size matters), so at first glance viewing individual data may seem ineffective. However, here are three examples of when it may be valuable to view the data for individual users.

Example One – One Audience Segment Outperforms Another

How people interact with your website will be affected by their age, gender, device, and a host of other factors. By segmenting your Analytics data, you can dive deeper into these user categories. Do a lot of mobile users drop off when they visit a certain page? Do 18-34 year old males make it past your product page? These are things that are definitely worth looking into and you might not know about without User Explorer.

Example Two – Understand Your Customer Profiles

You may have some idea how different audience segments engage with your site, but let’s take that a step further. Every business should create customer profiles to get inside the head of their target market. User Explorer can help with that. By incorporating User Explorer with the more commonly used sections of the Audience tab in Analytics you can further develop, expand, and learn about your customer personas.

Example Three – Upsell Higher Priced Products or Services

Why do some people buy your $1,000 product while others only opt for the $150 product? Through User Explorer you could learn that people who buy your higher-end product all visited a few key pages on your site that other people missed. If this is the case you can adjust your marketing strategy accordingly. Not all of the lower tier purchasers will buy the more expensive product, but some undoubtedly will.

Should I Use User Explorer?

Not all businesses will benefit from User Explorer. If your business is in a very particular niche and all of your website visitors are similar, you won’t get much value from it. If you only get a few conversions a month and don’t have a lot of people visiting your site you likely won’t benefit from User Explorer. If you have a product or service that appeals to all ages, genders, etc. then looking at the individual level may not add give you any insight.

User Explorer can be very valuable but like many advanced Google Analytics functions it’s not necessary for every business. If you want help understanding how people interact with your website or want to take your marketing to the next level contact us today!

When Should You Change an Ad?

“How long should I leave my ads running?”

“How often should you change your ad copy or image?”

“Has my ad been running long enough to know if it’s a good ad?”

These are questions I get asked frequently and, perhaps surprisingly, they all have the same answer.

Are you ready for it?

Answer: It depends.

I know, I know, that’s the kind of answer you’d expect from a marketer, but hear me out.

An ad should only be changed when you’ve reached statistical significance. Said another way, when you’ve reached a P-Value of .05 you should change your ads. Said again, when you’re 95% confident that one ad will outperform another ad you should pause the underperforming ad. Final time without any statistical jargon, when an ad will outperform another ad 19 out of 20 times you should pause the other ad. Only then can you pause the ineffective ad, duplicate the winner, and create a new variation to start the A/B test all over again.

Statistical significance, confidence levels, P-values … You may be wondering when this became a lesson on statistics. You can’t know when to change an ad without understanding some basic statistic concepts. Changing an ad for the sake of change is inefficient and ultimately won’t lead to better results. Hopefully these examples will help you understand the importance of statistical significance.

Example One

You have two ads running. Ad One has had 5 impressions and 1 click. Ad Two has had 5 impressions and 2 clicks.

Impressions Clicks Clickthrough Rate
Ad One 5 1 20%
Ad Two 5 2 40%

40% compared to 20% may seem significant, but is that enough data to determine which ad is more effective? At first glance you may think so, but let’s take a deeper look.

What happens if in the next 5 impressions Ad One gets 5 more clicks while Ad Two doesn’t get any more clicks?

Impressions Clicks Clickthrough Rate
Ad One 10 6 60%
Ad Two 10 2 20%

Now Ad One seems to be outperforming Ad Two. 5 more impressions could swing the balance again though, your sample size isn’t large enough and you need to let your ads run longer.

Example Two

Let’s try that again using similar, but larger, starting numbers.

Impressions Clicks Clickthrough Rate
Ad One 500 100 20%
Ad Two 500 200 40%

Ad Two is winning, but what happens when both ads get 5 more impressions and Ad One gets 5 more clicks while Ad Two doesn’t get any?

Impressions Clicks Clickthrough Rate
Ad One 505 105 20.8%
Ad Two 505 200 39.6%

The clickthrough rates barely change and Ad Two remains the top-performer.

Because the sample size (impressions in this case) in Example One was so small, you couldn’t with any confidence say which ad will outperform the other. Even 5 more impressions drastically changed the success rates (i.e. clickthrough rates). In Example Two though, 5 more impressions barely changed the success rate and Ad Two was still the winner.

General Rules of Thumb

Optimize based off of conversion rate when possible, otherwise use clickthrough rate.

When your success rates are similar you’ll need a much larger sample size.

When your success rates differ by a large margin you can get away with a smaller sample size.

The more traffic your ads get, the sooner you can reach statistical significance.

The less traffic you get, the longer your ads have to run before you can make a change.

Statistical Significance Calculators

Say you have a large sample size and the success rates seem to differ enough… Is it statistically significant? Unless the difference is drastic enough, there’s no way to look at a set of numbers and know if you’ve reached the 95% confidence level. Even then you shouldn’t trust your “gut”. This is where technology comes to the rescue. There are a number of statistical significance calculators out there, but I prefer House of Kaizen’s A/B/n split test significance calculator.

I like this calculator because it makes things simple. Going back to the first example, I’ll put the impressions under #Visitors and the clicks under Conversions. When I hit the calculate button the calculator tells me what confidence level I’ve reached. It even reminds me to wait for a 95% confidence level.

Statistical Significance Calculator

How Will This Affect My Campaign?

I don’t change ads for the sake of change. I only make changes when I’m 95% confident that one ad will outperform the other. By waiting to reach statistical significance I ensure I don’t pause an ad that will end up leading to more conversions or clicks. I duplicate the winner, make additional changes, and then start the process all over again. What this does is lead to an increase month over month in conversion rates or clickthrough rates. The increases aren’t always monumental (especially when I’ve been making these incremental improvements for a while), but they prove the system works. This is a screenshot from our AdWords manager account that shows the increase in clickthrough rate (in blue) and conversion rate (in red) since Epic Marketing implemented this optimization strategy.

AdWords Performance

As you can see, waiting for statistical significance before changing an ad has led to massive increases in both clickthrough rates and conversions rates in the last two years. This is a trend we expect to continue.

Final Thoughts

All things being equal, the longer your ads have been running or the larger your sample size the more likely you can determine a winner. You should wait until you reach statistical significance before changing an ad and there are many calculators that can help you know if you’ve reached it. By only changing an ad when you’re certain it’s the winner, you can achieve consistent month-over-month increases in conversion rates and clickthrough rates.

So back to our original questions:

“How long should I leave my ads running?”

“How often should you change up your ad copy or image?”

“Has my ad been running long enough to know if it’s working?”

Answer: It depends.

And now you know why.

YouTube Ad Formats: A Beginner’s Guide

Every year more and more companies are looking to video ads as a new way to promote their products and services. Although several different platforms offer video ads, YouTube is still king. YouTube has allowed companies to run ads since 2006 and their ad platform has come a long way from their fledgling “participatory video ads”. At the time of this post, YouTube offers in-stream ads, video discovery ads, and bumper ads. In this post I will break down the main differences between these three formats.

TrueView In-Stream Ads

The first type of TrueView ad, in-stream ads allow you to play your video before, during, or after another video. These can be skipped after 5 seconds. Because you’re only charged when someone interacts with your ad or watches 30 seconds of your video (or the entire duration if it’s less than 30 seconds), you can get free views by ending your video before 30 seconds and giving people the opportunity to skip the remainder of your video. In-stream videos are the preferred ad format for many advertisers.

TrueView Video Discovery Ads

Video discovery ads are the second type of TrueView ad and these appear with YouTube search results, next to related videos, or on the YouTube homepage. TrueView ads can vary in length, but the gold standard is 30 seconds. YouTube recommends no shorter than 12 seconds and no longer than 3 minutes. One benefit of video discovery ads is that your ads will have a thumbnail of your video and some text, but you will only be charged when someone clicks on the ad. Make sure to make the text count because you get exposure even if your ad isn’t clicked on.

Bumper Ads

Like in-stream ads, bumper ads play before, during, or after another video but aren’t skippable and must be 6 seconds or less. You pay based on impressions so make sure your video is succinct and memorable. Quite a few companies have found ways to do this, Geico’s Unskippable campaign in particular comes to mind. Because these ads can’t be skipped they’re good for getting your message out there.

Which Ad Format Should You Use?

With three different ad formats to choose from, it can be hard to choose what format to go with. Unless I have run similar campaigns before, I always let data determine what formats I use and I recommend you do the same. In-stream and video discovery ads are easy to test side-by-side, but unless you make a video with the 6 second limit in mind your video won’t perform well when shortened to 6 seconds.

If you’re new to video advertising it can feel a bit overwhelming, but never fear! Epic Marketing specializes in helping our clients achieve their KPIs, regardless of the platform. One of the best parts of working with a full-service agency is that we take a lot of the guesswork out of marketing. We’ve worked with hundreds of clients across dozens of verticals and industries. How can we help you?

PPC and Lock Picking: An Unlikely Comparison

Several months ago I decided I needed a hobby (apparently working doesn’t count). After doing some research I came across the noble art of lock picking. I bought a practice lock and a beginner’s lock pick set and got to work. A few days later, I was hooked. There was something immensely satisfying about pitting my skill and intellect against sophisticated locking mechanisms. I tried explaining the appeal of my newest hobby to several of my friends who also manage paid ads, but to no avail. It was only when I compared lock picking to PPC that they understood my new fascination. Following are some of the points that I came up with.

No Two Locks are the Same

Just like with PPC accounts, every lock is different. Locks made by the same manufacturer (think same industry) may appear to be similar, but odds are the internal mechanics are vastly different. What works for one lock is not guaranteed to work for another lock. Similarly, just because one AdWords account performs well on the Display network or with certain calls to action doesn’t mean all accounts will. Embrace the differences and capitalize on the strengths.

Assume Nothing, Test Everything

I have a few lock picks that I favor and tend to use almost exclusively. When I get a new lock, however, I start with the most basic lock pick and work my way up. I usually test all of my relevant lock picks before deciding which one to go with. Pay per click is the same way. Although there are generally accepted industry best practices, you won’t know for sure what works best until you perform several rounds of A/B tests. You need to set aside your assumptions and test everything. Data, not precedence, should determine direction.

Looks can be Deceiving

Some people mistakenly believe that you can determine how to pick a lock by examining its outside. The keyhole can give you some indication as to what type of pick and tension wrench you will need, but it’s when you start trying to lift the tumblers that you’ll learn about the lock. With paid ads, if you only look at the surface level metrics of an account (such as clickthrough rate, cost-per-click, clicks, etc.) you’ll miss a lot of the intricacies that lie below the surface. How are your ads contributing to bounce rate? Are certain times of day or days of the week outperforming others? Which ads are performing the best? A thorough account audit is necessary if you want to get a clear picture of your advertising efforts.

Learn/Set it and Forget it Doesn’t Work

Like any skill, lock picking can quickly be forgotten if you don’t practice. I know people who used to be quite proficient at picking locks, but after an extended period of inactivity lost most of what they once knew. It’s important to advertise your business, but if all you do is create an AdWords or Facebook advertising account and then forget about it. Your performance will suffer. A successful advertising campaign takes consistent effort.

Still Not Convinced?

Do you still think my lock picking and PPC analogy is a stretch? That’s ok, I’m a paid search manager and lock picking enthusiast, not a professional debater. I can’t convince you that they’re similar, but PPC and lock picking are two things that I love and the day may come when you’re in need of one or the other. We don’t offer locksmith services, but if you have any questions about your marketing efforts, call the experts here at Epic Marketing and we’ll be glad to help you!

Facebook or AdWords – Which One is Best for My Business?

Paid social ads or paid search ads? Facebook or Google AdWords? These are questions that many business owners ask themselves when they are ready to grow their businesses. Like many digital marketing questions, the answer depends on your business, industry, and goals. This article will help decide which advertising platform is best suited for your needs.

Why Do You Want to Advertise Your Business?

Before we get started, why are you advertising your business? This may seem like an obvious question, but the answer to this is crucial. Are you promoting your business to gain brand awareness? Perhaps you have a new product or service you want to advertise? Or if you’re like many businesses, you may simply want to generate new sales and leads. What you’re your answer, keep this question in mind as you read this blog.

Facebook’s Strengths

With over 1.65 billion monthly active users as of March 31, 2016, advertising on Facebook is an attractive option for many business owners. Utilizing Facebook’s elaborate targeting options, businesses can reach people who are likely to be interested in their product or service. You can target users by age, location, behaviors, languages spoken, household composition, and much more.

Facebook is great for marketing products or services people would benefit from or enjoy, but are not necessarily searching for. Many companies successfully use Facebook ads to promote webinars, free workshops, and other lead generating events. It can also be used as a way to increase brand awareness (this works particularly well with new companies.) Facebook gives you a variety of advertising options centered on influencing awareness, consideration, and conversion.

Facebook Ads

Google AdWords’ Strengths

Averaging around 40,000 search queries per second, 3.5 billion searches a day, and 1.2 trillion searches each year, Google is the 800-pound gorilla of search engines and they have the advertising platform to prove it. When set up properly, it’s hard to beat AdWords in relevancy. Through the Google search network and their search partners, advertisers can put an ad in front of a potential customer right when they search for it.

Instead of showing ads to people based on interests or behaviors, you can target by keywords or phrases typed or spoken into Google. For example, if you search “plumbers near me” you’ll see half a dozen companies competing for your business. You are far more likely to click on an ad after searching for plumbing services than you are while scrolling through your Facebook newsfeed. As long as there is sufficient search volume, many products and services do really well on AdWords. eCommerce products, in particular, do well thanks to Google’s shopping ads.

Do You Have to Choose One?

In a word, no! Don’t fall into the trap of thinking you have to choose between Facebook and AdWords. Many companies successfully use both advertising platforms as well as traditional marketing to further their business goals. You don’t need to choose one or the other!

Epic Marketing specializes in using traditional and digital marketing to help businesses reach the next level. Call us at 801.657.4383 to learn more about how Facebook and AdWords can help your business grow!