“How long should I leave my ads running?”
“How often should you change your ad copy or image?”
“Has my ad been running long enough to know if it’s a good ad?”
These are questions I get asked frequently and, perhaps surprisingly, they all have the same answer.
Are you ready for it?
Answer: It depends.
I know, I know, that’s the kind of answer you’d expect from a marketer, but hear me out.
An ad should only be changed when you’ve reached statistical significance. Said another way, when you’ve reached a P-Value of .05 you should change your ads. Said again, when you’re 95% confident that one ad will outperform another ad you should pause the underperforming ad. Final time without any statistical jargon, when an ad will outperform another ad 19 out of 20 times you should pause the other ad. Only then can you pause the ineffective ad, duplicate the winner, and create a new variation to start the A/B test all over again.
Statistical significance, confidence levels, P-values … You may be wondering when this became a lesson on statistics. You can’t know when to change an ad without understanding some basic statistic concepts. Changing an ad for the sake of change is inefficient and ultimately won’t lead to better results. Hopefully these examples will help you understand the importance of statistical significance.
Example One
You have two ads running. Ad One has had 5 impressions and 1 click. Ad Two has had 5 impressions and 2 clicks.
|
Impressions |
Clicks |
Clickthrough Rate |
| Ad One |
5 |
1 |
20% |
| Ad Two |
5 |
2 |
40% |
40% compared to 20% may seem significant, but is that enough data to determine which ad is more effective? At first glance you may think so, but let’s take a deeper look.
What happens if in the next 5 impressions Ad One gets 5 more clicks while Ad Two doesn’t get any more clicks?
|
Impressions |
Clicks |
Clickthrough Rate |
| Ad One |
10 |
6 |
60% |
| Ad Two |
10 |
2 |
20% |
Now Ad One seems to be outperforming Ad Two. 5 more impressions could swing the balance again though, your sample size isn’t large enough and you need to let your ads run longer.
Example Two
Let’s try that again using similar, but larger, starting numbers.
|
Impressions |
Clicks |
Clickthrough Rate |
| Ad One |
500 |
100 |
20% |
| Ad Two |
500 |
200 |
40% |
Ad Two is winning, but what happens when both ads get 5 more impressions and Ad One gets 5 more clicks while Ad Two doesn’t get any?
|
Impressions |
Clicks |
Clickthrough Rate |
| Ad One |
505 |
105 |
20.8% |
| Ad Two |
505 |
200 |
39.6% |
The clickthrough rates barely change and Ad Two remains the top-performer.
Because the sample size (impressions in this case) in Example One was so small, you couldn’t with any confidence say which ad will outperform the other. Even 5 more impressions drastically changed the success rates (i.e. clickthrough rates). In Example Two though, 5 more impressions barely changed the success rate and Ad Two was still the winner.
General Rules of Thumb
Optimize based off of conversion rate when possible, otherwise use clickthrough rate.
When your success rates are similar you’ll need a much larger sample size.
When your success rates differ by a large margin you can get away with a smaller sample size.
The more traffic your ads get, the sooner you can reach statistical significance.
The less traffic you get, the longer your ads have to run before you can make a change.
Statistical Significance Calculators
Say you have a large sample size and the success rates seem to differ enough… Is it statistically significant? Unless the difference is drastic enough, there’s no way to look at a set of numbers and know if you’ve reached the 95% confidence level. Even then you shouldn’t trust your “gut”. This is where technology comes to the rescue. There are a number of statistical significance calculators out there, but I prefer House of Kaizen’s A/B/n split test significance calculator.
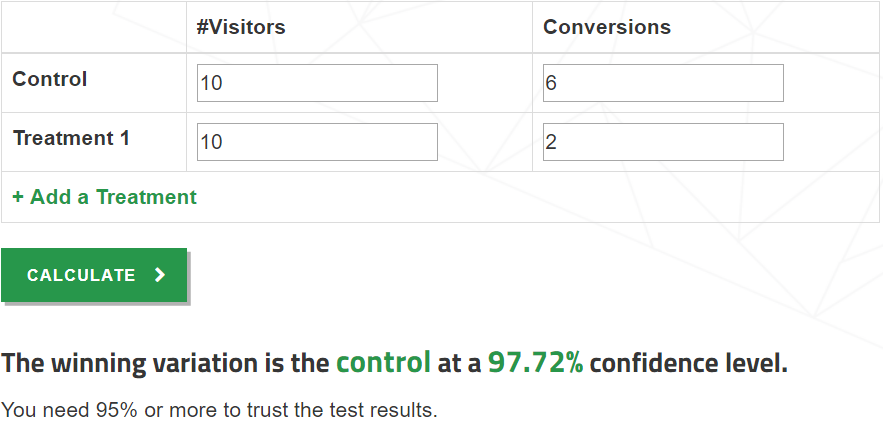
I like this calculator because it makes things simple. Going back to the first example, I’ll put the impressions under #Visitors and the clicks under Conversions. When I hit the calculate button the calculator tells me what confidence level I’ve reached. It even reminds me to wait for a 95% confidence level.

How Will This Affect My Campaign?
I don’t change ads for the sake of change. I only make changes when I’m 95% confident that one ad will outperform the other. By waiting to reach statistical significance I ensure I don’t pause an ad that will end up leading to more conversions or clicks. I duplicate the winner, make additional changes, and then start the process all over again. What this does is lead to an increase month over month in conversion rates or clickthrough rates. The increases aren’t always monumental (especially when I’ve been making these incremental improvements for a while), but they prove the system works. This is a screenshot from our AdWords manager account that shows the increase in clickthrough rate (in blue) and conversion rate (in red) since Epic Marketing implemented this optimization strategy.

As you can see, waiting for statistical significance before changing an ad has led to massive increases in both clickthrough rates and conversions rates in the last two years. This is a trend we expect to continue.
Final Thoughts
All things being equal, the longer your ads have been running or the larger your sample size the more likely you can determine a winner. You should wait until you reach statistical significance before changing an ad and there are many calculators that can help you know if you’ve reached it. By only changing an ad when you’re certain it’s the winner, you can achieve consistent month-over-month increases in conversion rates and clickthrough rates.
So back to our original questions:
“How long should I leave my ads running?”
“How often should you change up your ad copy or image?”
“Has my ad been running long enough to know if it’s working?”
Answer: It depends.
And now you know why.


