What’s the Difference Between Data, Analytics, Insights and Why Should I Care?

I’ve spoken at and have attended quite a few conferences during my career. One major theme that speakers and conference goers continually talk about is analytics, data and generating insights from both. It’s not uncommon to hear speakers lecture on the need to focus on data and how data is going to be the future of marketing.

While they are not wrong, many times speakers and leaders confuse data, analytics, and insights and use them interchangeably. This happens so frequently that we often forget that these three topics are very different and how we go about thinking about them within our businesses needs to be different as well.

So let’s explain the differences and how that information will help you propel your business forward.

Defining Data, Analytics, and Insights. What’s the Difference?

Data

Data is, simply put,  the points along the road. Data by itself is relatively useless without context. It doesn’t really help with our understanding of what is going on when we only look at a singular data point but collectively, it can help us see patterns we would have never seen otherwise.

You can’t optimize or extract knowledge from something that you’re not measuring. Every business is going to collect data differently because they all have different needs and will be focused on different objectives. Asking the question “what is important to our business” is a starting point that will help guide you in trying to figure out what data to collect.

Another thing to pay attention to is the context of the data that you are gathering. Data without context can easily lead to bad decisions because it won’t reflect the reality of what’s going on with your business.

Analytics

Analytics is the process of discovering patterns and trends from the data. Business Dictionary states the goal of analytics is to help a company by “gaining knowledge which can be used to make improvements or changes.”

Individuals and businesses can’t really do anything without analytics. Useful analytics almost always comes from ratios. Single data points don’t provide much actionable information but when combined into a series of data points or ratios, trends become much easier to see and understand.

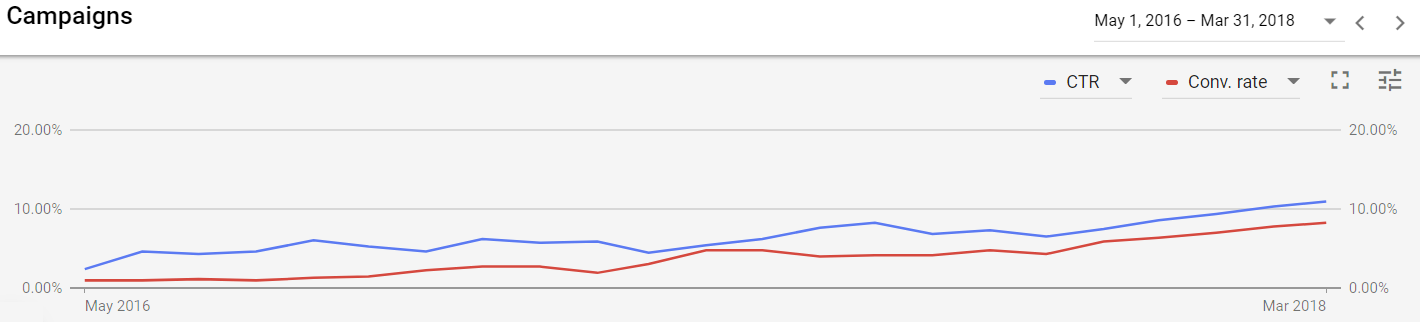
If your website receives 30,000 page views a month, is that good? Is it bad? Are you improving or do you need a website overhaul? Just looking at that single data point does little to help you understand almost anything about your website performance. But if you look and see that you have improved your monthly site traffic by 25% year over year or 10% month over month? That helps you understand a little bit more about whether or not your efforts have been effective.

Segmentation

Once you start looking at your analytics, make sure to start segmenting your analytics. As you start to put like-minded customers/visitors together, it will help you with the next section that we are going to go into which is insights.

The purpose of segmentation is to better understand your customers and individuals who interact with your company. Segmentation allows you to reduce the number of variables when it comes to your data so that you have a better context to understand the analytics.

A few examples of possible segments that you can do for your business are:

• Visits originating only from direct traffic and utilizing Chrome as their browser
• Customers who have the highest CLV (customer lifetime value)
• Visitors who remained on your site for longer than “x” minutes.

Insights

The most difficult part of dealing with data and analytics is simply just trying to understand what it is that you are observing. How are your customers actually behaving? What do they really want to know more about? How do they actually interact with your business? Analytics could be telling you a million different stories but insights is the process of understanding the true story of what is going on with your business and your customers.

Another way of framing this, every business can be viewed as a complicated mesh of different systems. While we love to think that we all understand exactly how everything works, no one actually knows how everything works 100% of the time. Not the founder, not the CEO…no one understands it completely.

Because of this, there is a gap in an employee’s understanding of the business and how it actually works. With this framework in mind, insights helps individuals to bridge this gap between their understanding of how the system works and how it actually works.

Insights is the “ah-ha” moment when data and analytics come together into a cohesive story that allows you to better see the reality of what’s going on with your business.

Remember, reporting does not equal insights. Reporting is the process of organizing data into summaries. Insights is the result of exploring data and reports in order to extract meaningful information to improve business performance. Reporting translates raw data into information. Analysis transforms data and information into insights.

Investigating the “that’s funny…”
Isaac Asimov captured the spirit of discovering insights perfectly when he said: “The most exciting phrase to hear in science, the one that heralds new discoveries, is not ‘Eureka!’ but ‘That’s funny…’”

As I mentioned earlier, the biggest issue businesses face when it comes to data and analytics is the gap between how they think the business runs and how it actually runs. These ‘that’s funny’ moments allows us to see areas where we are blinded by our own assumptions or previous experiences that we have had with the business. They allow us to step back and say to ourselves “we really need to look at this process because clearly something is going on here.”

How to turn Data into Insights

So now that we have all of the definitions out of the way, how do I actually pull insights from the data that we are collecting? Here are some useful tips to help you accomplish this goal.

• Ask yourself “what questions do we need to answer in order to succeed?”
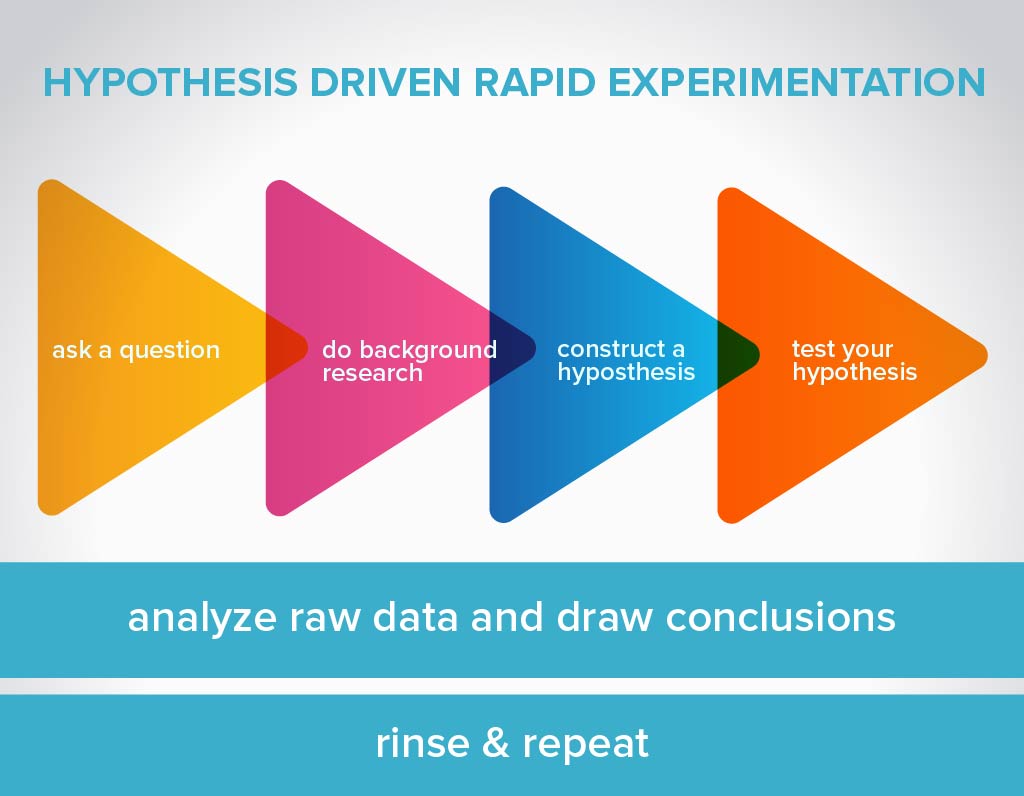
• Create a specific hypothesis prior to running an analyse.
• Start with small data, filter and segment those data to build larger segments.
• Work on a single problem at a time.
• Break complex systems into smaller pieces.
• Ask specific questions. Generic questions will produce generic answers.
• Measure loss/gain caused by your findings.

Hopefully you found these tips on the difference between data, analytics and insights helpful.

Need help finding insights for your business? Want us to help? Contact our team today!

Understanding Facebook Analytics

“Tactics without strategy is the noise before defeat.” -Sun Tzu

Most intermediate to advanced marketers love diving into tactics. It’s sexy and it brings this sense of “ah…that’s what I have been missing all along” feeling that also makes you feel like you have stumbled on some “holy grail” of marketing that will catapult your marketing efforts into the next stratosphere.

The problem is that most of your marketing issues have nothing to do with your tactics, but your lack of a cohesive strategy in implementing those tactics. So the question then remains, how do you put together a cohesive strategy?

Analytics and Facebook analytics specifically will help you better understand the user experience as they interact with your brand both online and off. How do new users find about your business/product/service? How do your existing customers become loyal, repeat customers?

Every business, especially if they have a heavy online presence, needs to refine their critical path for their new customers. What user flow is the most optimal for your business? Is it to hear about you online, go to a physical store and then ultimately find you again online when you have a promotion? Do they search for you on Google, fill out an interactive form on your website and then add your product to a cart and finish the checkout process?

Most businesses have several “critical paths” that their customers follow and your overall strategy should be to 1) figure out that path and 2) learn to optimize the path from the edges of the flow instead of rebuilding it every couple of months and having to restart your Facebook experiments from scratch..

So where does Facebook Analytics fall into this learning process?

Facebook Analytics will help you understand how your customers are actually behaving and which behaviors are most beneficial to your business. As you gain a better understanding of what behaviors you want to replicate, you’ll be able to create user flows that promote behaviors that you want to see in your customers and on the flip side, create flows that discourages behaviors that you want your potential customers to avoid.

Facebook Analytics and Google Analytics are not the same. Google Analytics is a comprehensive tool that enables you to look at more data than Facebook Analytics and allows you to do deeper dives into specific pages. On the other hand, Facebook Analytics is tied to a user, not a cookie and thus is best at showing you interactions among events so you can see opportunities to better cater your website/product offering that you maybe didn’t know were happening to specific individuals.

Event groups within Facebook Analytics allows you to look at omnichannel interactions. Many will argue that Google Analytics already provides this information but Facebook Analytics allows you to dive a bit deeper because it allows you to see post interactions in addition to page and website behaviors. You also can track offline data like in-store purchases and link them to your Facebook campaigns to see how your Facebook ads influenced those purchasing decisions.

There are three major reports that you can pull from Facebook Analytics: Funnels, Revenue and Customer Lifetime Value reports.

Funnels:

One of the best parts of the Facebook Analytics funnel reports is that they are able to tell you what actions individuals took on your Facebook page/ad prior to them converting into a customer. You can figure out of the individuals who “liked” this post, how many of them when to the website? Of those individuals how many of them ultimately ultimately lead to a sale? Understanding where along the funnels your customers are dropping out is one of the most invaluable pieces of information that Facebook funnels can provide.

Revenue:

Think of Revenue as a dashboard for purchase-related information. Let’s say you want to find out how many purchases were made through your app in a given time period. You could find this information in Revenue and examine it more closely by applying filters then create a funnel out of those insights as mentioned above.

Customer Lifetime Value:

Conventional reports in Business Manager merely look at the cost per conversion and revenue for each individual purchase. By looking at CLV, instead, we can see how much a customer is worth to us over the course of several months. You can break it down into a few factors:

• How often a customer makes a purchase within a typical purchase cycle
• How much a customer spends each time they make a purchase
• How much you project a customer will spend over the duration of your relationship with them
• The potential length of a customer’s relationship with you

As Facebook has stated “You shouldn’t use your prediction for any one of these factors alone as a representation of a given customer’s lifetime value. You should combine each relevant estimation into a formula appropriate for your business goals and use the result it produces.”

Facebook Analytics is just such an awesome tool to help individuals and companies understand how their Facebook efforts are working and where along the way they are dropping out.

Bonus freebie:

A lot of individuals ask us in addition to the reports above, what are some other Facebook specific metrics that we like to track. I have listed some of the most insightful metrics that provide the most amount of insights.

MAU (Monthly Active Users)
(# of Monthly Active Users/# of People Reached)

Audience Growth Rate
(# of new Facebook Fans/# of total fans on Facebook)

Engagement Rate
(# of engagements/# of posts)

Organic vs. Paid Traffic Rate

Average Revenue Per MAU
(MRR/Total Number of Customers)

Customer Acquisition Cost (CAC)
(Total Cost of Sales & Marketing/# of Sales)

Need a hand in understanding the constantly changing Facebook landscape? Contact us or call us and let our team of Facebook experts talk to you about your current Facebook marketing needs.

Most Popular Dessert by State in 2018

Current Mood = Dessert

If asked, picking one single dessert to eat for the rest of your life would be painfully hard. There are thousands of dessert variations to choose from, and like – #FOMO. 40% of consumers surveyed in a USA Today report say they eat desserts after a meal at least twice a week. 78% say they are more likely to eat dessert to treat themselves and 60% say they order dessert when they’re feeling happy.

Recognizing the challenge of different search queries (searching for recipes, places for dessert near you, etc.), we compared the top 3 searched desserts in each state utilizing the information found in Google Trends for the entire year of 2018. Mixed with some keyword research (some of these desserts sounded too absurd to be real – I’m talking to you, Florida and Georgia) we were able to finalize a list of the top dessert in each state throughout 2018.

A top choice by 1/5th of the states in the U.S. was a certain British pudding that, unbeknownst to me (and the entire staff at Epic Marketing), exists and apparently is delicious. Research showed and shocked our team to discover that Jell-O was not the top dessert in Utah, especially since it seems to be culturally popular! But hey, we decided that maybe Gelato is a distant cousin to Jell-O.

fav dessert by state

How did your home state compare?

How to Hack the Facebook Algorithm

Go to any social media/digital marketing conference and you’ll most likely see at least one class titled “How to Hack the Facebook Algorithm”. Everyone in the social media marketing industry is constantly trying to figure out and asking themselves, “how do I get Facebook advertising to work for me?”

According to Social Media Examiner, 51% of marketers don’t feel like their efforts in Facebook advertising are paying off. So what is happening? Why are so many marketers struggling to find success with Facebook? How do you hack the Facebook Algorithm?

The short answer is that you don’t. The medium answer is that you hack the algorithm by being adaptable and running experiments correctly.  The long answer is below.

Adapting

Those who don’t adapt, die. Let me show you one example of a simple Facebook hack we used at Epic to adapt. Many marketers have griped and complained about how the upcoming targeting changes on Facebook will negatively affect their advertising efforts. At Epic Marketing, our focus is on the bottom line. It’s what we do. We just do what we need to do in order to help your business grow and thrive by combining technology and our experience and insights. For example, while you might not be able to target individuals with certain “interest” or target “income” levels after August 15th, you can still create an Engagement Audience comprised of those individuals now. In other words, you can create a video targeting those “interest” or “income” audiences now, and create a custom audience comprised of those individuals who watched the videos longer than 3 seconds.

By doing this, you’ve now changed these individuals from a third party source, to a first party source you can remarket to indefinitely on Facebook. This huge hairy problem is now solved simply by thinking through the problem a little bit.

When your company or agency faces a large shift in the landscape, do they complain and throw their hands up? Or do they adapt? Digital marketing is constantly changing. Old norms are now out of date. Previous strategies that never worked now do. Purchase behaviors and attention spans change. It’s hard to find consistency in a landscape that is constantly shifting and updating itself so you have to adapt.

Dealing with a Constantly Evolving Digital Marketing Landscape

So what do we do here at Epic Marketing? What is our “secret sauce”? How are we able to produce results despite the fact that ad costs are increasing across search/social media and Facebook is becoming more restrictive in their targeting options? It’s simple really. We just follow the scientific method when running experiments. Pretty bland isn’t it?

Many marketers say they are “experimenting” but what they are actually doing is blindly guessing and constantly taking a shotgun approach with their strategies. Yes, every campaign takes some time to optimize and at first, especially when you have limited data, often times you are just taking your best guess at how to proceed. However, you shouldn’t be “guessing” 3 months into the campaign. The biggest problem with how a lot of marketers “experiment” is that they leave out one of the most crucial parts of the “experiment”, they forget to actually create a legitimate hypothesis.

“Let’s see what happens” is not a hypothesis. If that’s your hypothesis, you’ll see “what happens” 100% of the time but you won’t be any better for it. A well thought out experiment builds upon previous experiments, but how do you know the right follow up questions to ask if you never created a hypothesis to begin with?

Here’s a brief rundown of the scientific method with direct applications to advertising.

Ask a Question

Most people do this. It’s the question that you ask that forms the basis of your experiment. “Will switching images lead to a better conversion rate?”, “Will including the name of the city in the ad copy lead to more phone calls?”, etc.

Do Background Research

Again, most marketers and businesses will do this step fairly well. Just make sure you keep notes on where you are getting your information and the process along the way so that you can reference it later. As part of your research, make sure to include both qualitative as well as quantitative data in your reports. Quantitative data is the default metric that most marketers rely on but qualitative data helps paint the broader picture of what is going on.

Construct a Hypothesis

This is where far too many marketers fall short. Very rarely do they construct a hypothesis at all, let alone do it in a way that allows them to learn from their experiments. Remember that a hypothesis is an educated guess based on all of the research that has been done both internally and externally. This is not a “shot in the dark” at something you think will work. It is a statement of what you expect to happen and typically it is written in a cause and effect format (if _____ happens, we then expect ________ to occur). It’s a statement that is based on your “educated guess” and not on known data.

The other component needed for a well-written hypothesis is understanding what your variables are for your project. A good hypothesis defines the variables in easy-to-measure terms, like who the participants are, what changes will occur during the testing, and what you think the effect of the changes will be.

Make sure your hypothesis is “testable.” To prove or disprove your hypothesis, you need to be able to do an experiment and take measurements or make observations to see how two things (your variables) are related. You should also be able to repeat your experiment over and over again, if necessary.

To create a “testable” hypothesis make sure you have done all of these things:

• Thought about what experiments you will need to carry out to do the test.

• Identified the variables in the project.

• Included the independent and dependent variables in the hypothesis statement. (This helps ensure that your statement is specific enough.)

• Don’t bite off more than you can chew! Answering some scientific questions can involve more than one experiment, each with its own hypothesis. Make sure your hypothesis is a specific statement relating to a single experiment.

Test Your Hypothesis

This is a perfect example of garbage in, garbage out. You can waste countless man hours, money, and resources running experiments that don’t matter. Experimentation is a mechanism by which we can gain insights and useful information, but it’s not an insight in and of itself. It’s simply just another arrow in our quiver. Experimentation will help us support or refute a hypothesis, but we have to do the work to design a good hypothesis and a good experiment.

Some common mistakes marketers make while testing their hypotheses are:

• Starting with an untestable hypothesis. In other words, not having a reason for why your change will have the desired impact.

• Testing too many variations.

• Not determining up front what you consider to be good. Draw a hard line in the sand.

• Stopping your test at the wrong time. (Here is an online duration calculator that can help you prevent this)

Analyze Raw Data and Draw Conclusions.

Don’t just blindly follow the data. Generally, a researcher will summarize what they believe has been learned from the research, and will try to assess the strength of the hypothesis. Even if your hypothesis is proven to be false, a strong conclusion will analyze why the results did not turn out the way you initially thought.

Theoretical physicist Wolfgang Pauli once stated “it’s not only not right; it is not even wrong” in reference to the work of another fellow physicist. There is tremendous value in being wrong, the only time we truly fail with an experiment is when the experiment provided no additional information to our path of knowledge.

And herein lies the problem with most marketing campaigns. They don’t build upon the knowledge gained during previous experiments. They run an experiment, observe what happens and then create an entirely new experiment that has little to do with any of the observations from the previous experiments. Since they didn’t create a hypothesis, there was nothing specific to observe and therefore, no specific questions to build upon for the next round of experiments.

Want to see your Facebook ads perform better? Learn to adapt and learn how to perform experiments correctly and you’ll be surprised at the results that you achieve.

Need a hand in understanding the constantly changing Facebook landscape? Contact us or call us and let our team of Facebook experts talk to you about your current Facebook marketing needs.

When Should You Change an Ad?

“How long should I leave my ads running?”

“How often should you change your ad copy or image?”

“Has my ad been running long enough to know if it’s a good ad?”

These are questions I get asked frequently and, perhaps surprisingly, they all have the same answer.

Are you ready for it?

Answer: It depends.

I know, I know, that’s the kind of answer you’d expect from a marketer, but hear me out.

An ad should only be changed when you’ve reached statistical significance. Said another way, when you’ve reached a P-Value of .05 you should change your ads. Said again, when you’re 95% confident that one ad will outperform another ad you should pause the underperforming ad. Final time without any statistical jargon, when an ad will outperform another ad 19 out of 20 times you should pause the other ad. Only then can you pause the ineffective ad, duplicate the winner, and create a new variation to start the A/B test all over again.

Statistical significance, confidence levels, P-values … You may be wondering when this became a lesson on statistics. You can’t know when to change an ad without understanding some basic statistic concepts. Changing an ad for the sake of change is inefficient and ultimately won’t lead to better results. Hopefully these examples will help you understand the importance of statistical significance.

Example One

You have two ads running. Ad One has had 5 impressions and 1 click. Ad Two has had 5 impressions and 2 clicks.

Impressions Clicks Clickthrough Rate
Ad One 5 1 20%
Ad Two 5 2 40%

40% compared to 20% may seem significant, but is that enough data to determine which ad is more effective? At first glance you may think so, but let’s take a deeper look.

What happens if in the next 5 impressions Ad One gets 5 more clicks while Ad Two doesn’t get any more clicks?

Impressions Clicks Clickthrough Rate
Ad One 10 6 60%
Ad Two 10 2 20%

Now Ad One seems to be outperforming Ad Two. 5 more impressions could swing the balance again though, your sample size isn’t large enough and you need to let your ads run longer.

Example Two

Let’s try that again using similar, but larger, starting numbers.

Impressions Clicks Clickthrough Rate
Ad One 500 100 20%
Ad Two 500 200 40%

Ad Two is winning, but what happens when both ads get 5 more impressions and Ad One gets 5 more clicks while Ad Two doesn’t get any?

Impressions Clicks Clickthrough Rate
Ad One 505 105 20.8%
Ad Two 505 200 39.6%

The clickthrough rates barely change and Ad Two remains the top-performer.

Because the sample size (impressions in this case) in Example One was so small, you couldn’t with any confidence say which ad will outperform the other. Even 5 more impressions drastically changed the success rates (i.e. clickthrough rates). In Example Two though, 5 more impressions barely changed the success rate and Ad Two was still the winner.

General Rules of Thumb

Optimize based off of conversion rate when possible, otherwise use clickthrough rate.

When your success rates are similar you’ll need a much larger sample size.

When your success rates differ by a large margin you can get away with a smaller sample size.

The more traffic your ads get, the sooner you can reach statistical significance.

The less traffic you get, the longer your ads have to run before you can make a change.

Statistical Significance Calculators

Say you have a large sample size and the success rates seem to differ enough… Is it statistically significant? Unless the difference is drastic enough, there’s no way to look at a set of numbers and know if you’ve reached the 95% confidence level. Even then you shouldn’t trust your “gut”. This is where technology comes to the rescue. There are a number of statistical significance calculators out there, but I prefer House of Kaizen’s A/B/n split test significance calculator.

I like this calculator because it makes things simple. Going back to the first example, I’ll put the impressions under #Visitors and the clicks under Conversions. When I hit the calculate button the calculator tells me what confidence level I’ve reached. It even reminds me to wait for a 95% confidence level.

Statistical Significance Calculator

How Will This Affect My Campaign?

I don’t change ads for the sake of change. I only make changes when I’m 95% confident that one ad will outperform the other. By waiting to reach statistical significance I ensure I don’t pause an ad that will end up leading to more conversions or clicks. I duplicate the winner, make additional changes, and then start the process all over again. What this does is lead to an increase month over month in conversion rates or clickthrough rates. The increases aren’t always monumental (especially when I’ve been making these incremental improvements for a while), but they prove the system works. This is a screenshot from our AdWords manager account that shows the increase in clickthrough rate (in blue) and conversion rate (in red) since Epic Marketing implemented this optimization strategy.

AdWords Performance

As you can see, waiting for statistical significance before changing an ad has led to massive increases in both clickthrough rates and conversions rates in the last two years. This is a trend we expect to continue.

Final Thoughts

All things being equal, the longer your ads have been running or the larger your sample size the more likely you can determine a winner. You should wait until you reach statistical significance before changing an ad and there are many calculators that can help you know if you’ve reached it. By only changing an ad when you’re certain it’s the winner, you can achieve consistent month-over-month increases in conversion rates and clickthrough rates.

So back to our original questions:

“How long should I leave my ads running?”

“How often should you change up your ad copy or image?”

“Has my ad been running long enough to know if it’s working?”

Answer: It depends.

And now you know why.

Making Local SEO Work for Your Business

Every company needs to actively engage in local search engine optimization to be successful.

Google can make or break your business, and with most people not venturing past the second page in Google’s search, you’re missing out on potential customers by not having a content strategy and doing proper keyword research.

One of the biggest hurdles that companies face when crafting their search engine optimization strategy is competing with the biggest players in the market. If you’re a pizza restaurant, for example, you’ll go up against industry titans like Pizza Hut and Papa Johns if you’re trying to be found for a term like “pizza”. These companies have huge budgets and spend millions of dollars on marketing to stay at the top of the search engine results pages (SERPs). Most businesses don’t have the bandwidth or budget to compete head to head. What you can do though is focus on local SEO services offered to you.

Local search engine optimization operates on the same principles as the marketing you’re already doing. The difference is that it targets potential customers within a specific geographic area. With this, you’re speaking directly to the people who are in proximity to your business and therefore more likely to buy your product. Plus, you have a much better shot of showing up higher in the SERPs, it’s a win-win!

What Is Local Search Engine Optimization?

Local SEO services involve strategically choosing your keywords and adding in a specific geographic location. So, if you’re the pizza restaurant from our earlier example, you would use a keyword like “Pizza in Portland, Oregon” or simply “Pizza in Portland”. You’ll reach people in that area who are looking for a good slice and able to give your restaurant a try! Using a keyword research tool like Google’s keyword planner allows you to research how often a term is searched and make any adjustments to your organic and paid strategy.

What Are The Benefits Of Localizing Your SEO Strategy?

Localization does two things for you: it makes you a larger fish in a smaller pond which allows you to rise up through the search engine rankings more quickly and it puts you in touch with people who are both interested in your product and physically able to obtain it. If you’re interested in expanding your business to a larger market, localization helps tremendously. Building local credibility prior to establishing a national or international presence is essential. If you want to cement yourself as an authority in your town or city, local SEO is the key. Utilizing techniques like NAP consistency (name, address, phone number), local citations and meta data, you can dominate.

How Do You Localize Your Digital Marketing Strategy?

The first step is integrating properly localized keywords into your content. Write your website content and any supplementary blog posts with this purpose in mind. This will help you tremendously in organic rankings. Consider running Google AdWords alongside your organic campaign. Many successful companies run SEO and a Google PPC campaigns in tandem for maximum success. Together they add exposure on the SERPs and can help combat negative PR with keyword research. If you run a local PPC campaign, you’ll pay a lot less than you would for a generic, non-localized term and reach the more of the customers you want.

You can also leverage your social media platforms to enhance your local search engine optimization. Facebook ads are highly targeted and localized. The landscape of social is constantly changing, especially with the emergence of different advertising opportunities. Facebook has customizable audience options to target those who would be most interested. The data you collect from social campaigns might uncover other details about what audiences you really should be targeting and help you refine your overall SEO strategy.

Be sure that your website is completely responsive (mobile friendly). Google’s most recent algorithm is mobile-focused and takes into account if your site enhances the customer experience. There is a strong trend towards searching on mobile devices that isn’t changing anytime soon. People won’t tolerate pinching and zooming in on their smartphones anymore. Make your website as attractive and as user-friendly as possible.

Why Localized SEO Is Smart SEO

Local SEO is all about strategy. Focusing on local customers is an excellent way to boost your business. You’ll compete with fewer big players, attract customers who are physically able to consume your products or services and establish yourself as a local authority. This type of marketing is so important that even some big players, like Coke and Pepsi, are focusing on local markets to appeal to consumers in their hometowns. The advantage you have? You are actually a local business in your town, not an outside player. You can speak to people in person and you’ll stand out as a small business who serves the community. Don’t underestimate the support that a small business can get from their loyal patrons.

By employing smart keyword focus and maximizing social media platforms to emphasize your appeal locally, you’re making a smart business move that will pay huge dividends in the future! When evaluating your content and marketing strategy, stop thinking global and start thinking local. Contact Epic Marketing in Draper, Utah to see how we can boost your marketing through Epic’s digital local SEO services.